Preface
In this article, I will be using AI as a reference for material. This is not new for many people in the real world. There are many who are considering themselves true developers under the auspices of the title “vibe coder.” There is a difference between the two that must be fully comprehended.
The important item when working with AI is whether or not you care enough to learn what the generated code is doing. Do you understand the workings of the output so you may trust it for your application? If you are merely copying and pasting without coming to grips with what it generated, then you are missing out on an important learning moment. You are also exposing your product and yourself to potential troubles. That’s the difference between someone who takes their product seriously and someone merely checking the box to get a task done.
Also, remember to properly add references whenever possible. Give credit to the people who helped you in your project. They did the upfront work even if you end up rewriting most of it.
Introduction
It’s Christmas Time1 (more specifically, Advent2) so let’s have some fun! I always wanted to do a music visualization project. Math has a relationship with music3 that is often overlooked. A visualization is about presenting data in a way that can be quickly understood. With that thought, let’s create a special form of art for Christmas by combining music4 with a touch of math.
Where to Begin?
I have never done a music visualization before but have seen plenty of them. In my head, I see various dancing waves running in time with music. It all is good in thought but reality of the effort soon sets in. This is not something done without a tool or programming language. There is real work needed! However, it doesn’t have to be a drudgery. We can have fun with this effort!
There is always the beginning and ending point to a project. We put out our best hypothesis at the beginning but always seem to change it up as we progress to the end. You will hit points in the project where you need help. That’s where leaning on others can come to your aid. Unless you are a natural prodigy, expect to always have to learn something new.
I thought that I would be getting involved with some C coding again. Pointers to pointers to functions seem to be excessive for this project. With a bit of research, I see that this type of work can be done in many high-level languages. Since Python is still popular, I will go with that language.
With Python as our language, we should have some examples out there to use as a base. After some web queries using Google, I found there are plenty of examples. The explanation varies from different sites but this is an excellent start! They might not be 100% complete but we are learning here.
Here are the steps I have seen in creating a music visualization5:
- Acquire a handle to the music file (mp3, wav, and so on).
- Determine the sample rate of the music
- Play music (asynchronously)
- Run a Fast Fourier transform (FFT)6 analysis as the music plays (math, yay!)
- Use FFT data to get the magnitude for the visualization
- Display the graphical screen based on acquired metrics.
- Repeat till finished
This is the recipe for doing this type of work, but it is nuanced from one listing to another. Let’s talk briefly about FFTs as this is the most complicated part.
A FFT is a mathematical algorithm used to convert waves from time domain to frequency domain. This has many applications in engineering, such as signal analysis7. For our project, we will be using FFT techniques to extract the magnitude components from the music. This is a core part of the visualization to give it depth.
The reason it is called “fast” is that it provides the same discrete Fourier transform without calculation. The algorithm achieves this gain by splitting the problem into smaller segments. In other words, it takes a “divide and conquer” strategy. There are more detailed websites that show how this is accomplished. Please spend time learning the basic concepts as it useful for real-world analysis.
Fortunately, the FFT algorithm is built into numerous, pre-built libraries. Since Python is going to be used for this project, we can lean on numpy for FFT calculation. Picking Python for this project is looking like a success.
Coding with Examples
I took the examples Google delivered as a start. There are ones that use pygame8,9 for the graphics and audio. This caught my interesting as pygame is used to make video games. There are performance benefits to this approach as well as using existing libraries to avoid rebuilding the wheel. Remember, this is a project for fun.
I found the examples sufficient for learning the process. The mixer portion of pygame will prove to be useful for the music and numpy’s FFT will analyze the chunks of music data. As each chunk of music is played, the analysis gets performed. The function pygame.draw.lines will then draw out the objects for display on the scene. Wow, this project is coming together faster than expected!
Personal Touch
Now, I want to customize it. That’s where I was looking for help. I had some ideas.
There are points where I could make the waveform fuzzy looking with randomness. Still, it needs more than just some lines. How about a nice sine wave to give it a more dynamic look. After some trial, I decided to give generative AI10,11 a try.
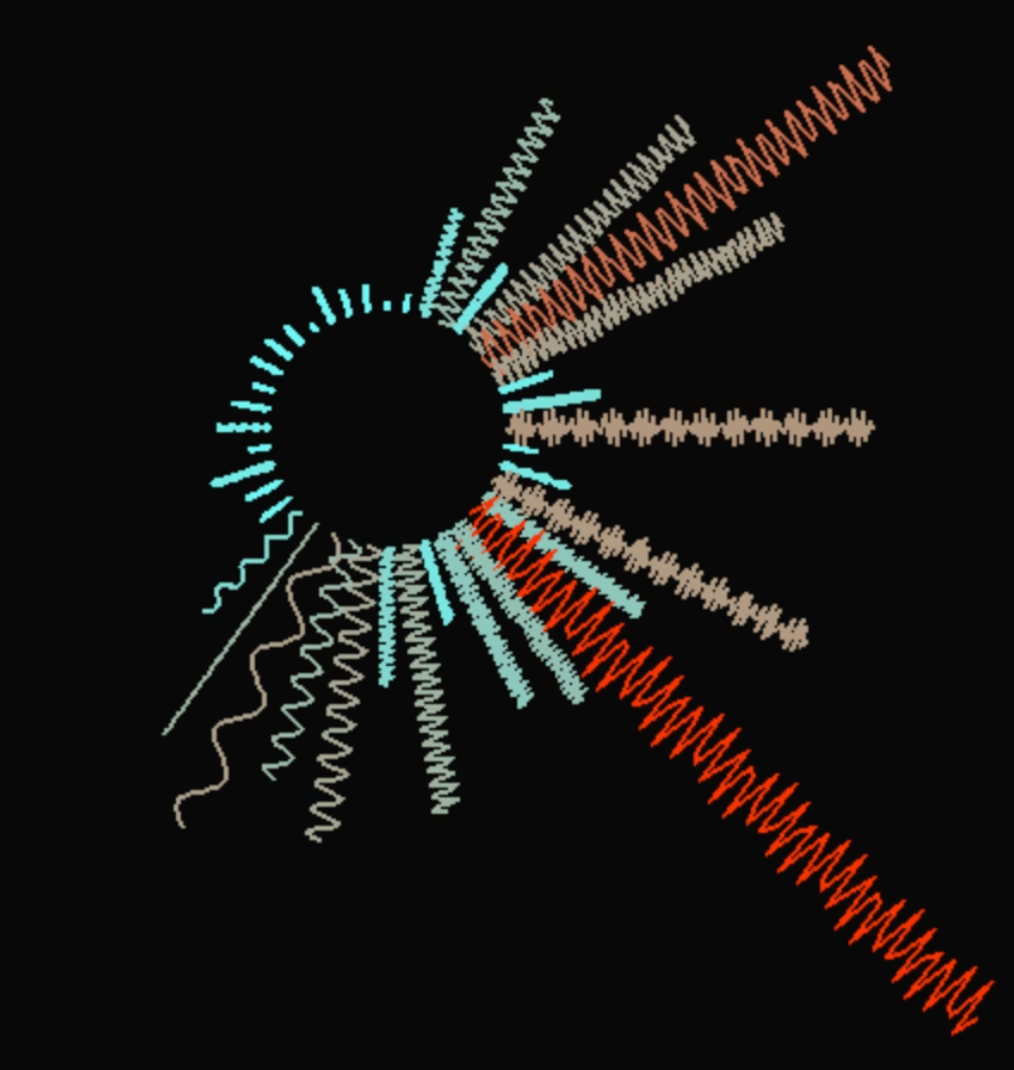
What AI generated from the code I fed it is impressive. The radial visualization approach it produced is a cool concept. Unfortunately, it did not list out many references. It did note that it took code from several github repositories doing the same thing. Interesting enough so we see AI uses existing code in an efficient manner but does not always provide references.
Moving on, there are still hallucinating moments to AI. Gemini has advanced to being useful for initial work. When pushed to customize code, it tries but eventually starts putting out images of code snippets and what could be described as cryptic graphs with no explanation. ChatGPT seems more prone to bugs in its initial code generation but gets it on the 2nd or 3rd round of prompting.
There is now a pile of code to go over. Again, don’t just accept the code. What works and what does not? Step through it and see what it is doing. Don’t be afraid to ditch it all and build your own based on what you learned. This is a trial and error learning experience. It’s ok to experiment as long as you keep yourself aware of what the code is doing.
In our case, I took 3 different code listings. The radial visualization approach is the base. Another listing showed an approach to build out a sine wave for the individual frequencies. A third listing has an approach for coloring.
Putting it all in one listing takes some time. My approach was to try each one separately in debug mode. Step through each line to see what it does. If there is documentation, try to line it up with the author’s description.
After that exercise, we have the components to create a neat visualization. Pull in the parts that work well, ditch the parts that overlap the other listings, and see what happens in debug mode.
Synchronization issue
I had a nice radial visualization generated with sine waves moving with different amplitude and frequency. The music I picked was from an old vinyl record of Christmas Music. Those various crackles and pops along with the warm singing provided a great sound to show off the work. Unfortunately, I found an issue. The visual dance is not synchronized with music. That had to be rectified!
Going back to the pygame manuals as well as some Googling gave me a few thoughts. Even the AI answers had thoughts but it had to come together without ruining the feel. This took some tinkering but the big help came from a pygame function: pygame.mixer.music.get_pos()
The timing of the playback by the mixer was separate from the FFT. The analysis was running too quickly and merely changing the timing or chunk size did not help. What works is to compare the expected position to what is the actual position in the mixer. If it’s out of synch, reset the cursor position to align with the mixer.
Now that it is synchronizing, how does the end result look. Well, let’s review it.
Results
It turned out pretty well! I like how the noise from the vinyl album has created a lot of dancing.
If you take the code and experiment with it, be sure to try out different settings for the constants. They can provide a very different look and feel!
Finally
This has certainly been a fun project. I learned a lot about how music visualizations work (and don’t work) as well as the benefits and hurdles of AI code generation. I can only imagine what it would have been like with a more low-level language. Maybe the synchronization issue would have been a threading problem but that’s a different discussion. *Note: If interested, look in the appendix section below for my attempt using Swift Playground and my iPad mini 6.
May you and your loved ones have a Very Merry Christmas and Happy New Year!
References
[1] USCCB. Christmas. Retrieved from: https://www.usccb.org/prayer-worship/liturgical-year/christmas
[2] USCCB. What is Advent? Retrieved from: https://www.usccb.org/prayer-worship/liturgical-year/advent
[3] Wikipedia. Pythagorean tuning. Dec. 2025. Retrieved from: https://en.wikipedia.org/wiki/Pythagorean_tuning
[4] Welch Chorale; James B. Welch. A Music Box Of Christmas Carols. 1952. Retrieved from: https://archive.org/details/lp_a-music-box-of-christmas-carols_welch-chorale-james-b-welch
[5] Avi Rzayev. How to create a music visualizer. Apr 30, 2020. Retrieved from: https://medium.com/analytics-vidhya/how-to-create-a-music-visualizer-7fad401f5a69
[6] Cory Maklin. Fast Fourier Transform Explained. Feb. 08, 2024. Retrieved from: https://builtin.com/articles/fast-fourier-transform
[7] Science Direct. Fast Fourier Transform. Dec. 2025. Retrieved from: https://www.sciencedirect.com/topics/engineering/fast-fourier-transform
[8] The Pygame Developers. pygame, version 2.6.0, The Pygame Foundation, 2024, www.pygame.org
[9] Henry J Schmale. PyGame FFT Audio Visualizations. 2021 January 07. Retrieved from: https://www.henryschmale.org/2021/01/07/pygame-linein-audio-viz.html
[10] Various Prompts. Gemini, Google, Dec. 2025, gemini.google.com
[11] Various Prompts. ChatGPT, OpenAI, Dec. 2025, chat.openai.com/chat
[12] Dimitri Brukakis. Audio visualization with CoreAudio, Combine and SwiftUI. Dec 28, 2023. Retrieved from: https://medium.com/@dbrukakis/audio-visualization-with-coreaudio-combine-and-swiftui-6dad66034e1c
[13] Luca Palmese. Creating a Live Audio Waveform in SwiftUI. Jun 5, 2025. Retrieved from: https://www.createwithswift.com/creating-a-live-audio-waveform-in-swiftui/
Appendix
Please note that any code listed here is in an AS-IS state.
Python Code
import pygame
import numpy as np
import soundfile as sf
import math
#import vidmaker

# Load audio file (mono)
audio_file = ''  # Replace with your file path
data, samplerate = sf.read(audio_file)
if len(data.shape) > 1:
    data = np.mean(data, axis=1)  # Convert stereo to mono
data = data / np.max(np.abs(data))  # Normalize

# Pygame setup
pygame.init()
WIDTH, HEIGHT = 800, 800
screen = pygame.display.set_mode((WIDTH, HEIGHT))
pygame.display.set_caption("Christmas Music Visualizer")
clock = pygame.time.Clock()

#video = vidmaker.Video("", fps=60, late_export=True)

# Audio playback
pygame.mixer.init(frequency=samplerate)
pygame.mixer.music.load(audio_file)
pygame.mixer.music.play()

# Visualization params
CHUNK_SIZE = 1024  # samples per frame
total_samples = len(data)
cursor = 0
SINE_WAVE_AMPLITUDE = 15  # Max side-to-side displacement (controlled by magnitude later)
SINE_WAVE_FREQUENCY = 4   # Number of full cycles along the length of the bar
NUM_WAVE_POINTS = 100      # Number of segments to draw the curve

center_x, center_y = WIDTH // 2, HEIGHT // 2
MAX_RADIUS = 300  # max length of bars
NUM_BARS = 40  # number of bars around the circle

running = True
while running and cursor + CHUNK_SIZE < total_samples:
    for event in pygame.event.get():
        if event.type == pygame.QUIT:
            running = False


    # Get the current playback time from the mixer in milliseconds
    playback_ms = pygame.mixer.music.get_pos()
    # Convert milliseconds to the number of samples played
    expected_cursor = int(playback_ms * (samplerate / 1000))

    # Check if the visualization has fallen behind the music
    # If the expected position is ahead of the current cursor, we need to process
    # the new chunk of audio that corresponds to the time difference.
    if expected_cursor > cursor:

        # Calculate how many new samples to process this frame
        samples_to_process = expected_cursor - cursor

        # Extract the chunk from the old cursor position up to the expected cursor position
        # Use max(1, samples_to_process) to ensure we always process at least one sample
        # and handle potential small jumps or negative values if needed (though get_pos()
        # should prevent this if used correctly).
        chunk = data[cursor : expected_cursor]

        # Update the cursor to the new position
        cursor = expected_cursor

        # --- Only perform FFT if a chunk was actually processed ---
        if len(chunk) > 0:

            # Extract chunk & FFT
            fft_data = np.abs(np.fft.rfft(chunk))
            fft_data = fft_data / np.max(fft_data)  # Normalize

            # We only take first NUM_BARS bins for visualization
            fft_data = fft_data[:NUM_BARS]

            # Clear screen
            screen.fill((10, 10, 10))

            # Draw radial bars
            angle_step = 2 * math.pi / NUM_BARS
            for i in range(NUM_BARS):
                magnitude = fft_data[i]
                bar_length = magnitude * MAX_RADIUS
                angle = i * angle_step - math.pi / 2  # Start at top (12 o'clock)

                # Calculate the angle perpendicular to the bar for the wave displacement
                perp_angle = angle + math.pi / 2

                # Scale the wave's amplitude based on the music magnitude
                current_amplitude = SINE_WAVE_AMPLITUDE * magnitude

                # --- Draw the Sine Wave Segment by Segment ---
                points = []

                # Iterate through the length of the bar
                for j in range(NUM_WAVE_POINTS + 1):
                    # 1. Determine the position along the bar (radius)
                    # We start the wave 50 pixels from the center, just like the original line.
                    r = 50 + (bar_length * (j / NUM_WAVE_POINTS))

                    # 2. Determine the wave displacement (perpendicular to the bar)
                    # Use a sine function based on the position along the bar (j)
                    # and scale it by the current amplitude.
                    wave_displacement = current_amplitude * math.sin(
                        j * (i +1) * SINE_WAVE_FREQUENCY * 2 * math.pi / NUM_WAVE_POINTS
                    )

                    # 3. Calculate the final (x, y) point for the wave
                    # The point is displaced from the radial line (angle) by the perpendicular angle (perp_angle).

                    # X component: Center + Radial Length * cos(Angle) + Wave Displacement * cos(Perp Angle)
                    x = center_x + math.cos(angle) * r + math.cos(perp_angle) * wave_displacement

                    # Y component: Center + Radial Length * sin(Angle) + Wave Displacement * sin(Perp Angle)
                    y = center_y + math.sin(angle) * r + math.sin(perp_angle) * wave_displacement

                    points.append((int(x), int(y)))

                # Color changes with magnitude
                color = (
                    int(100 + 155 * magnitude),  # red
                    int(50 + 205 * (1 - magnitude)),  # green
                    int(255 * (1 - magnitude))  # blue
                )

                # Draw the line segments connecting the calculated points
                if len(points) > 1:
                    pygame.draw.lines(screen, color, False, points, 2)

            pygame.display.flip()

            clock.tick(60)  # 60 FPS

#video.export(verbose=True)
pygame.quit()
Alternative Approach – SwiftUI on an iPad Mini
If you are here, you are interested in the other music visualization I pulled together using Swift12, 13. This one is very basic. It was done purely out of curiosity using an iPad mini for coding. I had to see if it could be done. I have a new respect for Swift Playground.
Please enjoy and find the code following this video.
Swift Code
MyApp
import SwiftUI

@main
struct MyApp: App {
    var body: some Scene {
        WindowGroup {
            ContentView()
        }
    }
}
ContentView
import SwiftUI

struct ContentView: View {

    // Initialize the analyzer and subscribe to its published properties
    @StateObject private var analyzer = WaveformAnalyzer()

    @State private var isPlaying = false

    var body: some View {
        VStack(spacing: 40) {

            Text("Merry Christmas!")
                .font(.title2)
                .fontWeight(.bold)

            // 2. The Waveform Visualization
            WaveformShape(amplitudes: analyzer.waveformData)
                .stroke(Color.cyan, lineWidth: 2) // Draw the path as an outlined stroke
                .frame(height: 200)
                .background(Color.black.opacity(0.8)) // Dark background for contrast
                .cornerRadius(10)
                .padding(.horizontal)
            // The wave changes frequently, but we want it to look smooth
                .animation(.linear(duration: 0.05), value: analyzer.waveformData.count)

            // 3. The Control Button
            Button {
                togglePlayback()
            } label: {
                Text(isPlaying ? "Pause" : "Play")
                    .font(.headline)
                    .frame(width: 200, height: 50)
                    .background(isPlaying ? Color.red : Color.green)
                    .foregroundColor(.white)
                    .cornerRadius(10)
            }

            Spacer()
        }
        .padding(.top, 50)
    }

    // Toggles the player state
    private func togglePlayback() {
        if isPlaying {
            analyzer.stop()
        } else {
            analyzer.play()
        }
        isPlaying.toggle()
    }
}
WaveformAnalyzer
import Foundation
import AVFoundation
import Combine
import SwiftUI

class WaveformAnalyzer: ObservableObject {

    // Published array of normalized amplitude values (0.0 to 1.0) for drawing
    @Published var waveformData: [CGFloat] = Array(repeating: 0.0, count: 128)

    // Audio engine components
    private let engine = AVAudioEngine()
    private let player = AVAudioPlayerNode()
    private var audioFile: AVAudioFile?

    // Configuration
    private let bufferSize: AVAudioFrameCount = 1024
    private let visualizationPoints = 128 // Number of points/lines to draw on the screen
    let audioFileName = "01.01. Joy To The World - The First Noel - Sing We Noel.mp3" // Ensure this file is in your project bundle

    init() {
        setupAudioSession()
        loadAudioFile()
        setupEngine()
    }

    // MARK: - Setup

    private func setupAudioSession() {
        do {
            try AVAudioSession.sharedInstance().setCategory(.playback, mode: .default)
            try AVAudioSession.sharedInstance().setActive(true)
        } catch {
            print("Failed to set up audio session: \(error.localizedDescription)")
        }
    }

    private func loadAudioFile() {
        guard let url = Bundle.main.url(forResource: audioFileName, withExtension: nil) else {
            print("Error: Could not find \(audioFileName) in bundle.")
            return
        }

        do {
            audioFile = try AVAudioFile(forReading: url)
        } catch {
            print("Error loading audio file: \(error.localizedDescription)")
            audioFile = nil
        }
    }

    private func setupEngine() {
        guard let file = audioFile else { return }

        // 1. Attach and connect player
        engine.attach(player)
        let mainMixer = engine.mainMixerNode
        let format = file.processingFormat
        engine.connect(player, to: mainMixer, format: format)

        // 2. Install a tap on the output to capture audio data
        mainMixer.installTap(onBus: 0, bufferSize: bufferSize, format: format) { [weak self] (buffer, _) in
            self?.processAudioBuffer(buffer)
        }

        // 3. Schedule the file for playback (and loop it)
        player.scheduleFile(file, at: nil) {
            self.loadAudioFile() // Re-load the file to reset its cursor
            self.player.scheduleFile(self.audioFile!, at: nil)
        }

        // 4. Start the engine
        do {
            try engine.start()
        } catch {
            print("Error starting audio engine: \(error.localizedDescription)")
        }
    }

    // MARK: - Buffer Processing

    private func processAudioBuffer(_ buffer: AVAudioPCMBuffer) {
        guard let channelData = buffer.floatChannelData?.pointee else { return }

        // 1. Get the raw audio samples (mono or left channel of stereo)
        let sampleCount = Int(buffer.frameLength)
        let samples = Array(UnsafeBufferPointer(start: channelData, count: sampleCount))

        // 2. Downsample and process samples to get visualization points
        let step = sampleCount / visualizationPoints
        var newWaveformData: [CGFloat] = []

        // Take the peak (maximum absolute value) for each group of samples
        for i in 0..<visualizationPoints {
            let startIndex = i * step
            let endIndex = min(startIndex + step, sampleCount)

            let slice = samples[startIndex..<endIndex]

            // Find the maximum absolute amplitude in this slice
            let maxAmplitude = slice.reduce(0.0) { max(abs($0), abs($1)) }

            // Normalize and clamp the value to 0.0 - 1.0 range
            newWaveformData.append(CGFloat(maxAmplitude))
        }

        // 3. Update the published array on the main thread for SwiftUI
        DispatchQueue.main.async {
            self.waveformData = newWaveformData
        }
    }

    // MARK: - Playback Controls

    func play() {
        guard player.isPlaying == false else { return }
        player.play()
    }

    func stop() {
        player.pause() // Pause is better than stop for instant restart
        // Reset waveform to flat when paused
        DispatchQueue.main.async {
            self.waveformData = Array(repeating: 0.0, count: self.visualizationPoints)
        }
    }
}
WaverformShape
import SwiftUI

struct WaveformShape: Shape {
    let amplitudes: [CGFloat]

    // Conforms to Shape protocol; defines the path to draw
    func path(in rect: CGRect) -> Path {
        var path = Path()

        guard !amplitudes.isEmpty else { return path }

        // Calculate the horizontal spacing for each point
        let widthPerPoint = rect.width / CGFloat(amplitudes.count)
        let center = rect.midY

        // Start the path at the baseline
        path.move(to: CGPoint(x: 0, y: center))

        for (index, amplitude) in amplitudes.enumerated() {
            let x = CGFloat(index) * widthPerPoint

            // The amplitude is a value between 0.0 and 1.0.
            // Scale it by half the view's height (center) for drawing.
            let height = center * amplitude

            // Draw a vertical line from the peak down to the trough
            let topPoint = CGPoint(x: x, y: center - height)
            let bottomPoint = CGPoint(x: x, y: center + height)

            // Move to the top point and draw the line segment
            if index == 0 {
                path.move(to: topPoint)
            } else {
                path.addLine(to: topPoint)
            }
            // Draw the line down to the bottom point
            path.addLine(to: bottomPoint)
        }

        // Complete the path back to the end baseline
        let lastX = rect.width
        path.addLine(to: CGPoint(x: lastX, y: center))

        return path
    }
}